Match Overview – Dolphins vs Rams
Game Date, Venue & Final Score
On November 11, 2024, the Miami Dolphins traveled to face the Los Angeles Rams at SoFi Stadium in Inglewood, California, in Week 10 of the NFL regular season. The Dolphins emerged victorious with a 23–15 win, snapping a three-game skid while halting the Rams’ three-game winning stretch.
Quick Match Summary (Who Won & Why It Mattered)
Despite being outgained 327 total yards to 238, Miami’s ability to convert in the red zone, force turnovers, and capitalize on key moments made the difference. Los Angeles showcased offensive yardage and volume but was unable to punch the ball into the end zone, settling for field goals instead.
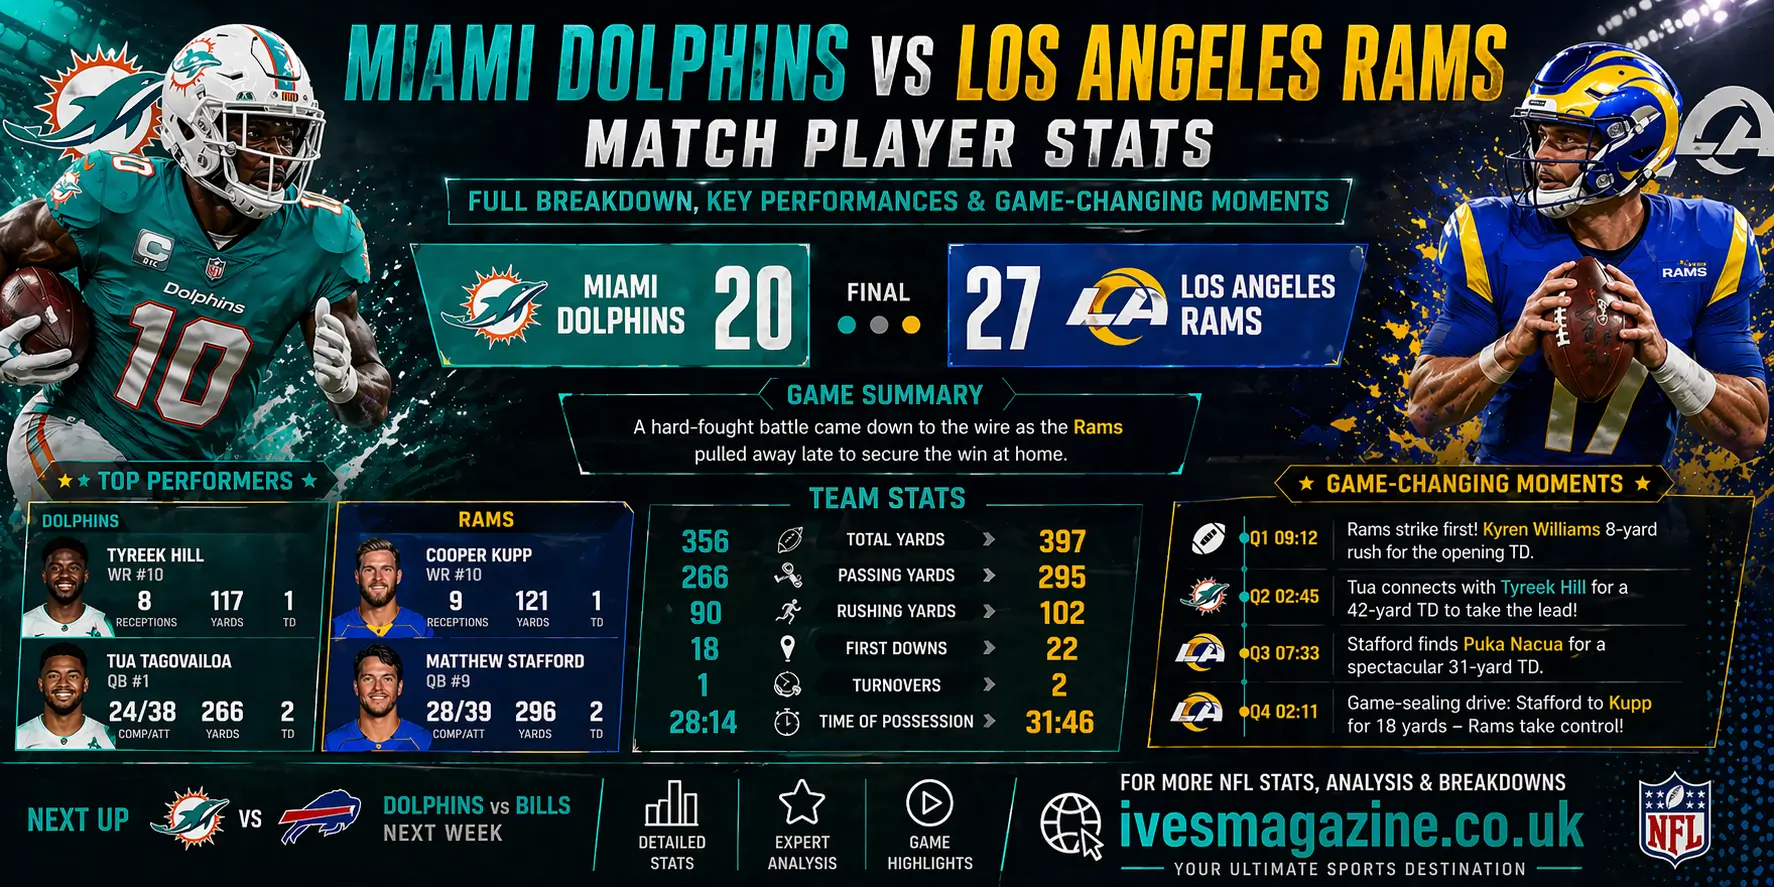
Miami Dolphins vs Los Angeles Rams – Team Stats Comparison
Here’s how both teams stacked up in the key stat categories:
| Category | Dolphins | Rams |
|---|---|---|
| Total Yards | 238 | 327 |
| Passing Yards | 171 | 257 |
| Rushing Yards | 67 | 70 |
| Red Zone Efficiency | 2-3 (67%) | 0-3 (0%) |
| Time of Possession | 29:48 | 30:12 |
| Penalties (Yards) | 1 (15) | 6 (64) |
| Turnovers | 2 | 2 |
| Sacks | 4 | 3 |
| Total Plays | 53 | 68 |
Quarterback Matchup & Passing Stats
Tua Tagovailoa Player Stats & Performance Analysis
Dolphins quarterback Tua Tagovailoa went 20-for-28 with 207 passing yards, 1 touchdown, and 1 interception. His efficient play kept Miami’s offense moving, and his touchdown connection with Tyreek Hill proved decisive in the third quarter. Tagovailoa’s passer rating hovered around 89.4, reflecting solid accuracy and situational execution.
Matthew Stafford Player Stats & Performance Analysis
Rams veteran Matthew Stafford was busy through the air, completing 32 of 46 passes for 293 yards. However, he was unable to throw a touchdown — the absence of a scoring pass proved costly. Stafford also threw 1 interception and was sacked four times for 36 yards in losses, highlighting how pressure disrupted offensive rhythm.
Quarterback Efficiency Comparison (Tua vs Stafford)
- Tagovailoa: 207 yards, 1 TD, 1 INT, efficient third-down play
- Stafford: 293 yards, 0 TD, 1 INT, high volume but low scoring output
Although Stafford produced more yardage, Tagovailoa’s efficient ball placement and scoring play helped Miami win the game.
Rushing Stats & Ground Game Analysis
Miami Dolphins Rushing Leaders & Efficiency
Miami leaned on a multi-runner approach on the ground:
- De’Von Achane: 12 carries, 37 yards (3.1 avg)
- Malik Washington: 1 carry, 18 yards, 1 TD
- Other rushers contributed sporadically to round out the team total.
With 67 rushing yards on 22 attempts, the Dolphins averaged 3.0 yards per carry — respectable but not dominant. The key rushing moment came early with Malik Washington’s 18-yard touchdown run that set the tone.
Los Angeles Rams Rushing Leaders & Efficiency
The Rams’ ground game featured:
- Kyren Williams: 15 carries, 62 yards (4.1 avg)
- Backups added small contributions, leading to 70 total rushing yards.
Los Angeles had a slight edge in rushing efficiency, but their inability to convert those yards into red zone success limited impact.
Which Team Won the Ground Battle?
- Rams: 70 yards at 3.9 ypc
- Dolphins: 67 yards at 3.0 ypc
Los Angeles had a minor rushing edge but failed to use it to sustain scoring drives.
Receiving Stats & Target Distribution
Miami Dolphins Receiving Leaders
Miami spread out targets with several contributors:
- Jaylen Waddle: 3 receptions, 57 yards
- Tyreek Hill: 3 receptions, 16 yards, 1 TD
- De’Von Achane: 5 catches, 15 yards
- Others filled in with lesser totals but helped maintain ball movement.
Hill’s touchdown, though modest in yardage, came at a pivotal moment and shifted momentum.
Los Angeles Rams Receiving Leaders
The Rams’ receiving game was more voluminous:
- Puka Nacua: 9 receptions, 98 yards
- Cooper Kupp: 7 receptions, 80 yards
- Davis Allen: 5 receptions, 34 yards
Despite big target numbers, none of these catches culminated in a touchdown, underlining red zone inefficiency.
Receiving Efficiency vs Volume Comparison
- Rams: 32 receptions on 44 targets for 293 yards
- Dolphins: 20 receptions on 28 targets for 171 passing yards
Los Angeles had more production and volume, but Miami’s impact plays generated actual scoring results.
Defensive Stats, Sacks & Turnovers
Dolphins Defensive Performance Breakdown
Miami’s defense was crucial:
- 4 sacks (helping disrupt the Rams passing rhythm)
- 1 interception (Anthony Walker Jr. early stop)
- Forced fumbles and key stops limited Rams touchdown opportunities.
Their ability to halt drives in the red zone paid dividends.
Rams Defensive Performance Breakdown
Los Angeles also produced pressure and defensive plays, recording 3 sacks and an interception. However, they couldn’t prevent Miami from converting critical downs, nor could they force enough points from turnovers.
How Defense Shaped the Final Score
The Dolphins defense consistently made stops inside the 20 and leveraged turnovers to swing momentum. Holding an offense with 327 total yards to five field goals is a testament to situational awareness and execution.
Red Zone Efficiency – The Real Difference in the Game
Dolphins Red Zone Success Rate
Miami converted 2 of 3 red zone trips into touchdowns — a 67% success rate. Their ability to cash in on opportunities translated directly to scoring that the Rams couldn’t match.
Rams Red Zone Failures Explained
Los Angeles went 0 of 3 inside the red zone, settling for field goals each time. Despite moving the ball effectively, this inefficiency was the core reason they fell short.
Why Yardage Didn’t Equal Points for LA
Outgaining an opponent but failing to score touchdowns is a classic case of poor red zone performance. Los Angeles amassed yardage but not the scoring output needed to win — a key NFL lesson underscored by this game.
Special Teams & Kicking Stats
Special teams played an oversized role in the scoring:
Joshua Karty Field Goals – Rams’ Only Points
Rams kicker Joshua Karty accounted for all Los Angeles scoring with 5 field goals, including from 34, 55, 53, 22, and 31 yards — keeping the Rams competitive but ultimately short of a touchdown’s worth of points.
Jason Sanders’ Clutch Kicks for Miami
Dolphins kicker Jason Sanders added field goals (including a 50-yard kick) that sealed the victory late in the fourth quarter.
Field Goals vs Touchdowns Impact
The Dolphins balanced their points with touchdowns and field goals, whereas the Rams relied entirely on field goals — an imbalance that decided the final margin.
Key Turning Points & Game-Changing Moments
Malik Washington’s Early Rushing Touchdown
On Miami’s first drive of the night, rookie running back Malik Washington ran it in from 18 yards for the opening score, setting the tone and forcing Los Angeles to play catch-up.
Tyreek Hill’s Crucial Receiving Touchdown
Hill’s third-quarter touchdown from Tagovailoa extended the lead and broke the game open when it mattered most.
Defensive Stops That Shifted Momentum
Anthony Walker Jr.’s early interception and multiple red zone defensive stands kept Los Angeles from converting yardage into touchdowns and shifted control to Miami.
Strengths & Weaknesses – Team-by-Team Analysis
Miami Dolphins Strengths & Weaknesses
Strengths
- Efficient scoring inside the red zone
- Opportunistic defense
- Clutch kicking
Weaknesses
- Lower total yardage
- Below-average rushing production
- Reliance on execution on key downs
Los Angeles Rams Strengths & Weaknesses
Strengths
- Strong passing yardage production
- Receiving depth and yardage
- Competitive rushing efficiency
Weaknesses
- Red zone inefficiency
- Penalties costing key yards
- Lack of touchdown conversions despite yardage
Head-to-Head History & Recent Trends
Though this article focuses on this specific matchup, Miami has had historical success against Los Angeles in recent years — often winning close games with efficient execution and opportunistic defensive play.
What These Player Stats Mean for Future Matchups
What the Rams Must Fix Before the Next Meeting
- Improve red zone efficiency
- Convert yards into touchdowns
- Reduce penalties and turnovers
What the Dolphins Should Continue Doing
- Maintain balanced offensive production
- Lean on red zone execution
- Keep forcing stops in key defensive areas
Complete Player Stats Summary Table
Miami Dolphins Key Player Stats Recap
| Player | Category | Stat |
|---|---|---|
| Tua Tagovailoa | Passing | 20/28, 207 yds, 1 TD, 1 INT |
| Malik Washington | Rushing | 1 carry, 18 yds, 1 TD |
| Jaylen Waddle | Receiving | 3 rec, 57 yds |
| Tyreek Hill | Receiving | 3 rec, 16 yds, 1 TD |
| Dolphins Defense | Sacks | 4 sacks |
| Jason Sanders | Kicking | 3 FGs, incl. 50 yds |
Los Angeles Rams Key Player Stats Recap
| Player | Category | Stat |
|---|---|---|
| Matthew Stafford | Passing | 32/46, 293 yds, 0 TD, 1 INT |
| Puka Nacua | Receiving | 9 rec, 98 yds |
| Cooper Kupp | Receiving | 7 rec, 80 yds |
| Kyren Williams | Rushing | 15 carries, 62 yds |
| Joshua Karty | Kicking | 5 FGs |
Frequently Asked Questions (FAQs)
Who won the Miami Dolphins vs Los Angeles Rams match?
The Dolphins won 23–15 on November 11, 2024.
Who had more passing yards in Dolphins vs Rams?
Stafford outgained Tua with 293 passing yards to Tagovailoa’s 207.
Did the Rams score a touchdown?
No. All Rams points came from field goals by Joshua Karty.
Who scored the Dolphins’ touchdowns?
Malik Washington and Tyreek Hill combined for Miami’s touchdowns.
Why did Miami win despite fewer total yards?
Miami excelled in red zone efficiency, creating higher points per opportunity, while the Rams settled for field goals.
Final Verdict – What the Stats Truly Reveal
The Dolphins’ 23–15 win over the Rams was shaped not by yardage dominance but by impact moments, red zone execution, defensive resilience, and dependable kicking. While Los Angeles moved the ball effectively, Miami made the plays that truly mattered.
Read More: David Borhaz